Using the Oscilloscope Windows
The larger oscilloscope window is the main window. It is the window that has cursors. Cursors can be added by right-clicking in the main window. Cursors can be dragged around the window using the mouse. Cursors can also be dragged off the edge of the window. The cursor values are displayed at the bottom of the control and information panel.
The two other windows are the sub windows. The sub windows do not have cursors. However, either of the sub windows can be exchanged with the main window by double-right clicking on the sub window. When the mouse is moved over any of the windows, the status bar will display the value under the mouse. Oscilloscope Window Modes
Waveform Reconstruction Modes
Reconstruction refers to the method of drawing the captured waveform and spectrum "between the data points".
Channel Display Settings and Scaling
Oscilloscope Capture Modes
Trigger Modes and Configuration
The oscilloscope can trigger at various voltage levels in positive or negative slope modes on Channel 1. After a trigger event, the oscilloscope begins to capture the waveform. There is no circular buffer and no pre-trigger data stored in the oscilloscope. Also, the first data point captured after a trigger event is a minimum of 2.6 microseconds. The actual trigger delay is configurable to be a longer period of time as well. After the first data point is captured, subsequent data points are captured with timing and order specified by the sampling mode until the 256 byte buffer on the oscilloscope microcontroller is full.
Sampling modesThe sampling mode being used by the PPMScope is reported on the panel below the sample rate. The PPMScope has three modes of sampling:
Sequential (default) mode - the sequential sampling mode is good for repetitive waveforms or single channel non-repetitive waveforms. The frequency range for the sequential sample mode is from 1 MHz to 11 Hz. The method for capturing waveforms using the sequential sampling mode is as follows:
A few key things to notice. Channel 1 and Channel 2 are not sampled at the same time. It is assumed that Channel 1 and Channel 2 retain the same phase relationship relative to the trigger and are repetitive. If the trigger is off the phase relationship between Channel 1 and Channel 2 is not reliable. Also, the screen refresh rate for the sequential mode is 0.15 seconds for each channel or 0.3 seconds to refresh both Channel 1 and Channel 2. Interlaced mode - the interlaced sampling mode is good for non-repetitive waveforms on both channels. The frequency range is lower than the sequential sampling mode at 417 kHz to 11 Hz. The method for capturing waveforms using the interlaced sampling mode is as follows:
The PC program will display the two waveforms with the proper phase relationship even though Channel 2 is sampled 1.2 microseconds later than Channel 1. Also, the screen refresh rate is 0.15 seconds to refresh both Channel 1 and Channel 2. Time Equivalent mode - the time equivalent sampling mode is good for repetitive waveforms on both channels. Time equivalent sampling mode must be used in conjunction with a trigger. If no trigger is selected when entering time equivalent mode, then the default trigger mode is a negative slope trigger. The frequency range for the time equivalent sample mode is from 5 MHz to 2.5 MHz. The method for capturing waveforms using time equivalent sampling mode is as follows:
With this methodology, a time equivalent sampling of a high frequency is captured for a repetitive waveform by sampling at a lower frequency after many trigger events. The picture below illustrates how this works: 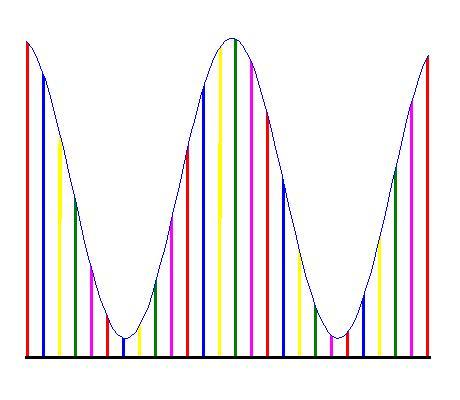
Each color represents a subset of samples. For example, to achieve a 5 Mhz equivalent sampling rate, the red samples would be sampled at 1 Mhz, the blue delayed by 200 ns and sampled at 1 Mhz, the yellow delayed by 400 ns and sampled at 1 Mhz, etc. The samples are reordered by the PC in an alternating color pattern as shown in the picture and the waveform is displayed AS IF it were sampled at 5 Mhz. This method works well for repetitive waveforms only. The screen refresh rate is 0.15 seconds for each channel and 0.3 seconds to refresh both channels.
Auto Measurements
The application can make up to four auto measurements on either channel at the same time. The measurements are described below.
AcRms - returns the Root Mean Squared value of the waveform without the DC component. Avg - returns the average value of the waveform. DutyCycle - returns the duty cycle (a decimal representing the time when the signal is above average) of the waveform. Falltime - returns the time the signal transitions from within 20 percent of the maximum value to within 20 percent of the minimum value. Freq - returns the frequency of the waveform. Magn - returns the magnitude of the fundamental of the waveform. Max - returns the maximum value (voltage) of the waveform. Min - returns the minimum value (voltage) of the waveform NDutyCycle - returns the negative duty cycle (a decimal representing the time when the signal is below average) of the waveform. NPulsewidth - returns the amount of time that the waveform is within 20 percent of the minimum value. Period - returns the amount of time of a single period of the waveform PerAvg - returns the average value of the waveform over a single period. The main difference between the PerAvg and Avg function is that the Avg function gives the average value of the waveform as displayed in the window (including edge effects) while the PerAvg function gives the average value of the waveform over a single period. PerRMS - returns the Root Mean Squared value of the waveform over a single period (includes the DC component). PerAcRms - returns the Root Mean Squared value of the waveform over a single period without the DC component. Phase - returns the phase of the fundamental of the waveform. Ptp - returns the peak to peak value of the waveform. Pulsewidth - returns the amount of time that the waveform is within 20 percent of the maximum value. Risetime - returns the time the signal transitions from within 20 percent of the minimum value to within 20 percent of the minimum value. Rms - returns the Root Mean Squared value of the waveform including the DC component. SNR - returns the Signal to Noise ratio of the waveform. The Signal to Noise ratio is calculated as the power of the signal divided by the power of the noise OR as the square of the amplitude of the signal divided by the square of the amplitude of the noise. THD - returns the Total Harmonic Distortion of the signal defined as the sum of the harmonic powers divided by the fundamental frequency power. THDN - returns the Total Harmonic Distortion plus Noise of the signal defined as the total waveform power minus the fundamental frequency power and then divided by the fundamental frequency power. This is the same as the THD, but adds the noise between harmonic frequencies to the harmonic power used in THD. TimeOfMax - returns the time between the beginning of the sample window and the maximum value of the waveform. TimeOfMin - returns the time between the beginning of the sample window and the minimum value of the waveform. |
PPMScope
Projects |

|
Content on this site is licensed under a Creative Commons Attribution 4.0 License.
I hope the information here is useful to those that find it. Page last update 2014 Aug 12. |
